Although a timeline and a Gantt chart are often used indistinctly, there is a difference between the two of them.
Timeline
A timeline is a simple graphical representation of a sequence of events or milestones over time. It usually consists of a horizontal axis that represents time, with events marked as points along the axis. You can use a timeline to show the chronology of events or milestones, without indicating the duration or dependencies of each event.

Gantt chart
On the other hand, a Gantt chart also shows the duration of each task or activity in a project, as well as their dependencies. It represents project schedules and progress, and is a more complex and detailed representation of a project timeline.
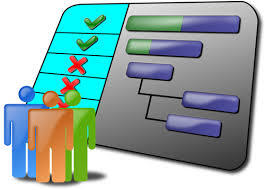
In a Gantt chart, each task is represented by a horizontal bar, with its length indicating the duration of the task and its position on the time scale indicating its start and end dates. The Gantt chart also shows dependencies between tasks by arrows or lines connecting the bars. Overall, the Gantt chart provides a more complete and detailed picture of a project’s schedule and progress than a simple timeline.

Conclusion
All in all, both, a timeline and a Gantt chart, shows a sequence of activities in a project over time. But, while a Gantt chart shows each task in a different line along a vertical axis, a timeline summarizes all tasks in just one line. Normally, a timeline will contain milestones instead of tasks with its start and finish date.
Now, you already know the difference between a timeline and a Gantt chart. You just need to decide which one best suits for your reporting and control requirements. Either way, you can start creating them with Ganttasizer.