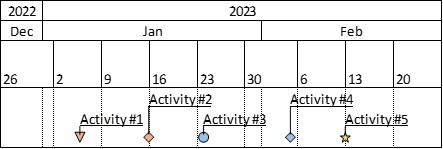
Gantt charts are a popular tool used in project management to visualize the activities required to complete a project. A Gantt chart consists of a horizontal timeline that represents the project schedule, with each activity represented as a horizontal bar that spans the duration of the task. Moreover, Gantt charts support dependencies between activities represented as lines connecting the bars.
Gantt charts were invented by Henry Gantt in the early 20th century and have since become a staple of project planning and tracking.
What elements should a Gantt chart contain?
In this section, we’ll go over the main elements that make a Gantt chart what it is.
- Task list: A list of all the tasks involved in the project. It is often displayed on the left-hand side of the chart.
- Timeline: A horizontal axis representing the timeline of the project,.
- Bars: Bars that represent the duration of each task. The length of the bar indicates the amount of time the task will take to complete. The bars are usually positioned along the timeline axis and stacked vertically to show task dependencies and progress.
- Milestones: Markers or symbols that represent important project milestones, such as the completion of a major task or the delivery of a project milestone.
- Dependencies: Arrows or lines that connect related tasks to show dependencies between them.
- Progress markers: Lines or shaded areas that show the current progress of the project. The project manager should update them on a regular basis to reflect actual progress compared to the planned schedule.
A well-designed Gantt chart should be easy to read and understand, with clear and consistent formatting and labeling. It should provide a visual representation of the project schedule and progress, enabling stakeholders to track the status of the project and identify potential delays or risks.

What information should a Gantt chart include?
The task list in a Gantt chart should contain all the tasks required to complete the project. Typically, each task will be a row in the task list, with columns to indicate the following information:
- Task ID: A unique identifier for the task, such as a number or code. This can be helpful for tracking the task throughout the project and for referencing it in other project documents.
- Task name: A brief but descriptive name for the task.
- Start date: The planned start date for the task, often shown as a specific date or a milestone that marks the beginning of the task.
- End date: The planned end date for the task, often shown as a specific date or a milestone that marks the completion of the task.
- Duration: The length of time required to complete the task, often shown in days, weeks, or months.
- Dependencies: A list of any tasks that must be completed before the current task can start. This can help to identify critical paths and potential delays in the project schedule.
By including all of this information in the task list, the Gantt chart can provide a comprehensive overview of the project schedule and progress. Thus, enabling stakeholders to track the status of the project and make informed decisions about resource allocation and risk management.
Which are the key features and benefits of Gantt charts?
Gantt charts are a powerful tool for project managers that can help ensure projects are completed on time and within budget. These are some of their key features:
- Task identification: Gantt charts provide a clear overview of all the tasks required to complete a project, allowing project managers to identify potential roadblocks and bottlenecks early on.
- Timeline visualization: By plotting each task on a timeline, Gantt charts provide a visual representation of the project schedule, including start and end dates for each task.
- Dependency tracking: Gantt charts allow project managers to identify dependencies between tasks and adjust the project schedule accordingly. For example, if Task A cannot start until Task B is completed, the Gantt chart will reflect this relationship and automatically adjust the timeline as needed.
- Resource allocation: Gantt charts can help project managers allocate resources (such as personnel, equipment, or funding) more effectively by showing time allocation for each resource.
- Progress tracking: As the project progresses, project managers can update the Gantt chart to reflect the status of each task, allowing them to track progress and adjust the project plan as needed.
- Communication: Project manager can use Gantt charts to communicate the project plan and progress to stakeholders and team members in a clear and easy-to-understand format.
However, Gantt charts do require careful planning and maintenance to be effective. The project manager must keep the accuracy of the timeline and task dependencies up-to-date in order for the chart to be useful.
Find out the best way to start creating your Gantt charts today.
Now you already know what a Gantt chart is, so you are ready to start creating your Gantt charts.
One of the key feature you should ask for in a tool designed to create Gantt charts is to be easy to understand and mantain. Most users prefere to use a well known tool like Excel to create their Gant charts. Nevertheless, Excel does not contain any built-in function to create Gantt charts and the process to do it yourself is complex and inefficient.
Discover the best way to create your Gantt charts in Excel and start using Ganttasizer today.


